


By Jeff Smith – Images by the Author, Penny Kuser, Mike Morgan & Andy Starr
A long, long time ago the traveling circus used to come to town, and part of that experience was the barker whose sole goal was to separate you from your money. One version of the ploy was the guy would guess your weight and then ask you to step on his scale. If he was right, it cost you, if he was wrong, you won a token prize. His scale was likely inaccurate.
That traveling circus has evolved into fast cars blasting down the quarter-mile but you can become that all-knowing predictor (with a little help from your smartphone calculator) to amaze your friends with your knowledge of quarter-mile potential. Right away you’re probably thinking, “Yeah, this will be some complex, long-haired formula that only geeky math majors will know how to use!” While we do have a few formulas to satisfy the math geeks, the most important one could not be easier to remember and use.
The goal of this simple exercise is to use the car’s quarter-mile trap speed to estimate an ideal elapsed time (e.t.). The formula is deceivingly simple yet holds up under intense scrutiny.
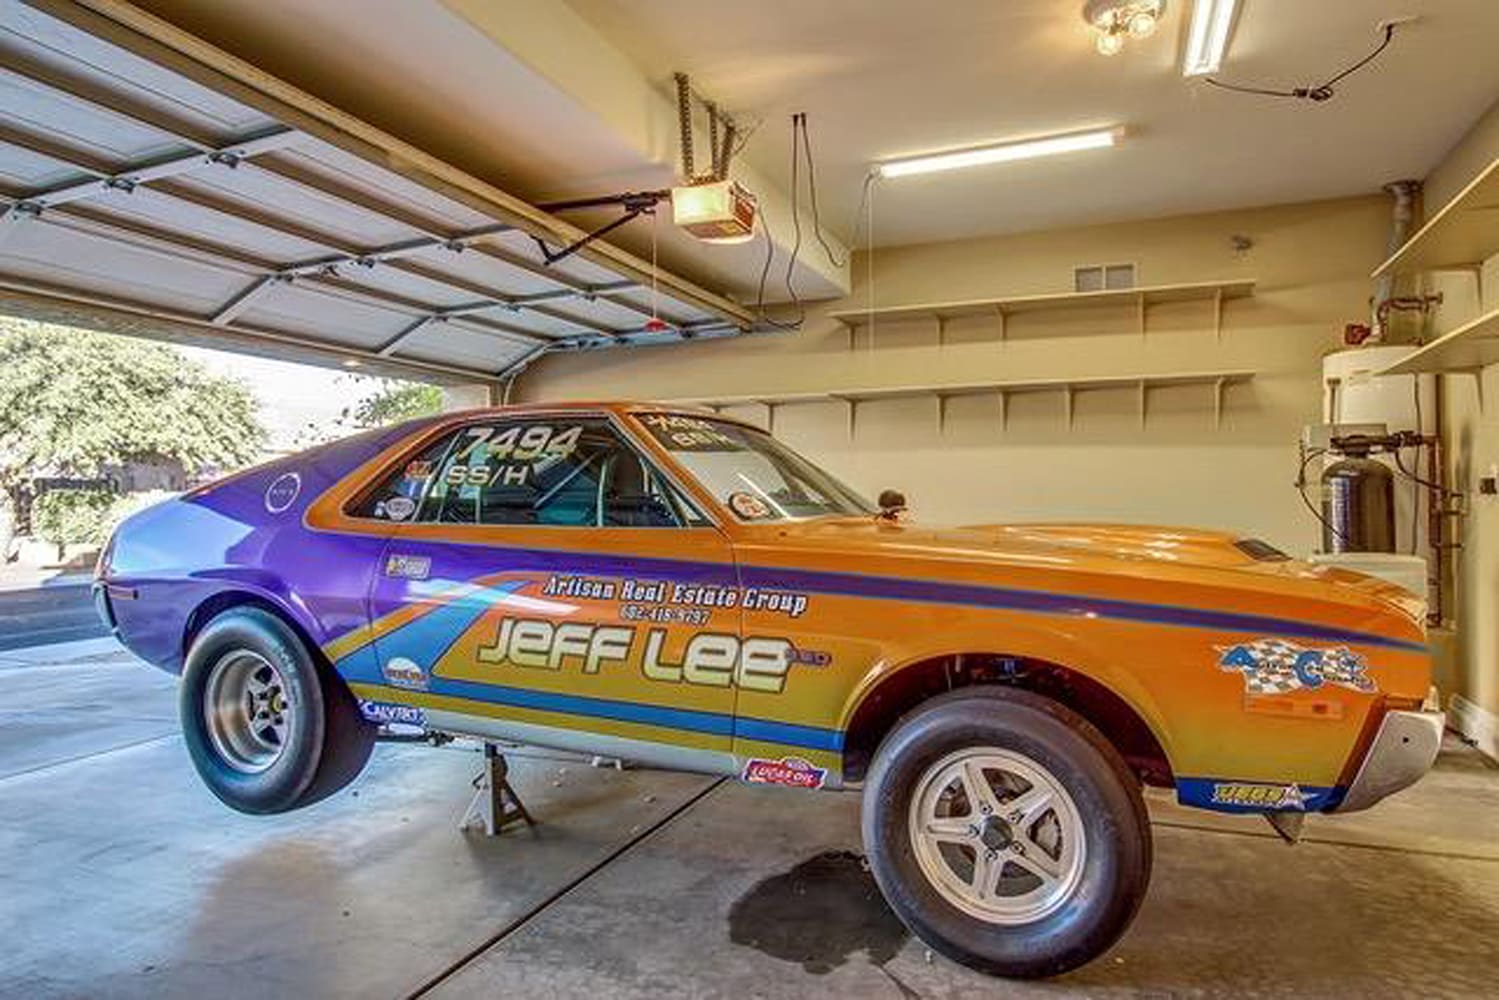
An NHRA drag racer by the name of Jeff Lee, who campaigns a successful NHRA SS/G AMX contacted us after a story we’d written about our five most favorite car guy math formulas. Lee offered a deceptively simple formula that he said originated from a long-since-forgotten Internet source.

Idealized Elapsed Time for Quarter-Mile = 1,320 / MPH
There’s also an equally simple one for eighth-mile enthusiasts: Idealized Elapsed Time for Eighth-Mile = 660 / MPH
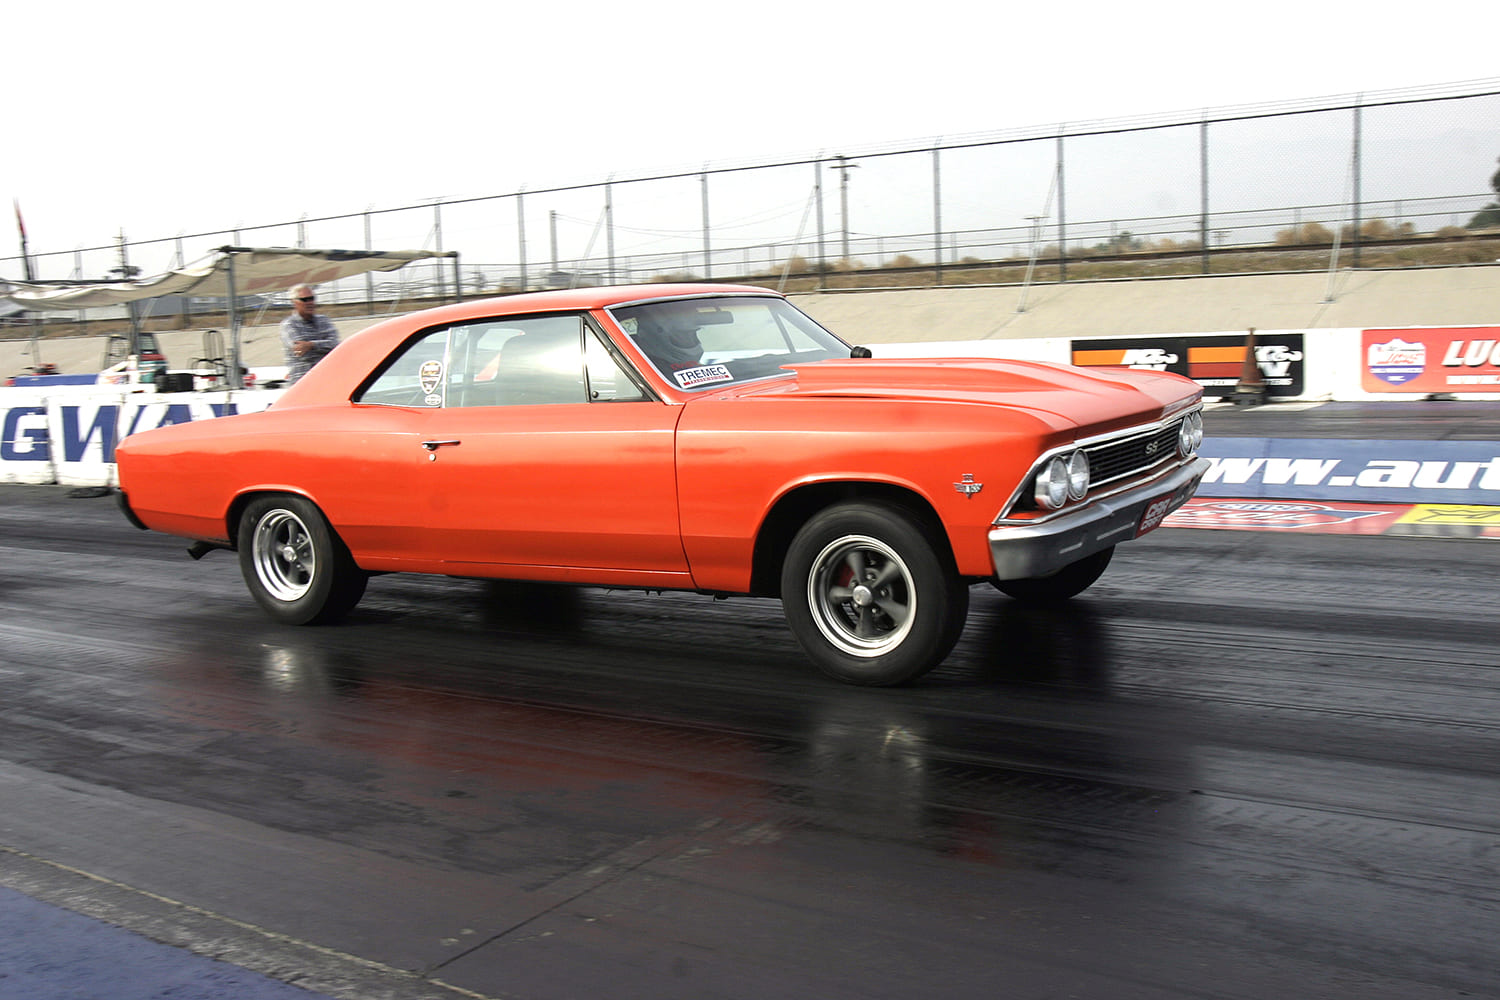
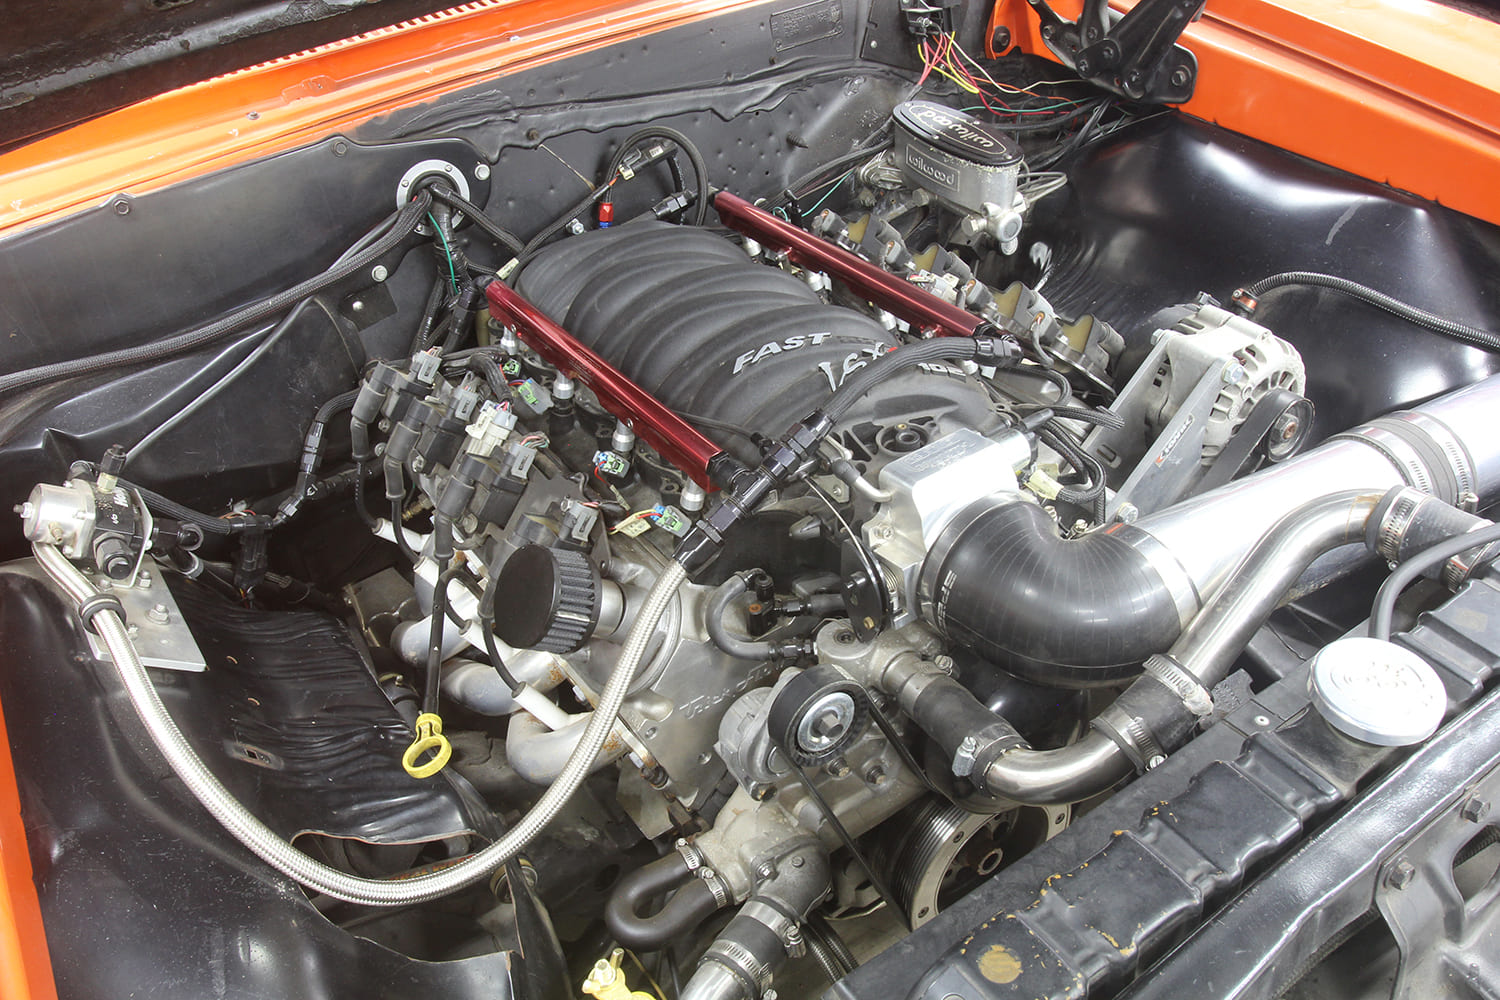
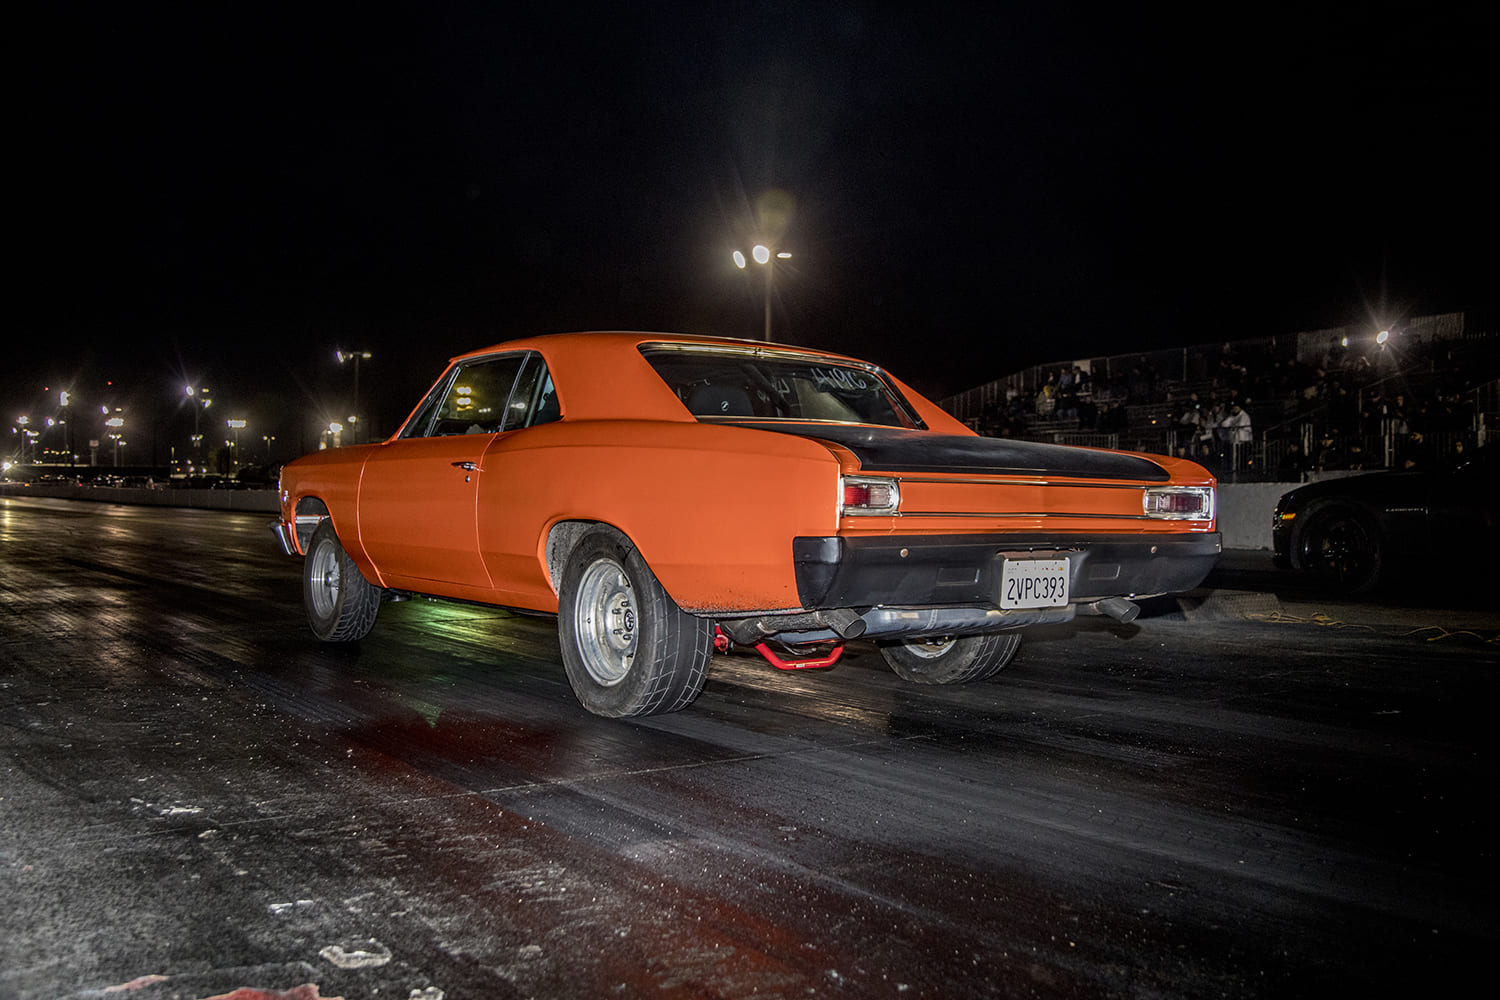
Lee shared the quarter-mile equation with us and said that it works best when applied to normally aspirated engines, so the first thing we did was crunch mph numbers for our own car. For this first example, we have run extensive testing on our 1966 Chevelle with a 550hp, 6.0L LS engine in a 3,600-pound street car in the eighth-mile. Longtime magazine enthusiasts may remember this car as the Orange Peel Chevelle used in various All Chevy Performance magazine stories and before that in Car Craft magazine. We used our Chevelle’s best eight-mile pass of 6.982 at 99.56 mph to compare to this calculated e.t. in the eighth-mile. Using the formula, the optimal number came up 6.629 or a little over 0.36-second quicker than our best e.t.’s. This indicates that we have more work to do in order to optimize this car’s acceleration potential.
In performing hundreds of these calculations, we’ve discovered that most cars run between 0.30- to 0.50-second slower than their optimized number. Our Chevelle falls right into this same situation. Our car runs well, but not nearly as quick as it potentially could.


Before we go much further, it’s also important to state that this is just a simple elapsed time estimator based on average acceleration. In virtually all forms of vehicle acceleration, the highest rate of acceleration occurs on or near the starting line (assuming no tire spin) and then the rate of acceleration slows down as speed increases. Yet this simple formula assumes average acceleration, which means it must be flawed. Despite this, the ultimate numbers are very close. That’s all we really care about, anyway. We can use this simple formula to judge how well our car is covering a given track length. We’ll leave the rest of this to the physics teachers of the world.
We were intrigued by the simplicity of this formula and decided to plug in other real numbers. The first place we went was to NHRA’s record books to test this equation against some of the best normally aspirated drag racers in the country.
We referenced NHRA’s Stock Eliminator records and chose a couple of cars that hold both the e.t. and mph records. In G/Stock, which is a manual transmission class, Tony Valerio from Welland, Ontario, Canada, owns the record with an 11.30 at 116.43 mph. Running the formula we found the calculated e.t. to be 11.337. This wheel-standing 1968 Camaro actually runs 0.03-second quicker than the calculated number. This further reinforces that this calculator is merely an indicator and not a carved-in-stone calculation.
We then moved over to Super Stock where we found Brian Oakes of Taylorsville, North Carolina, with his SS/CA that currently holds both ends of the record with an 8.79 at 150.50 mph. Applying our equation revealed an 8.770 theoretical number against his actual 8.79 that’s within 0.02 second.

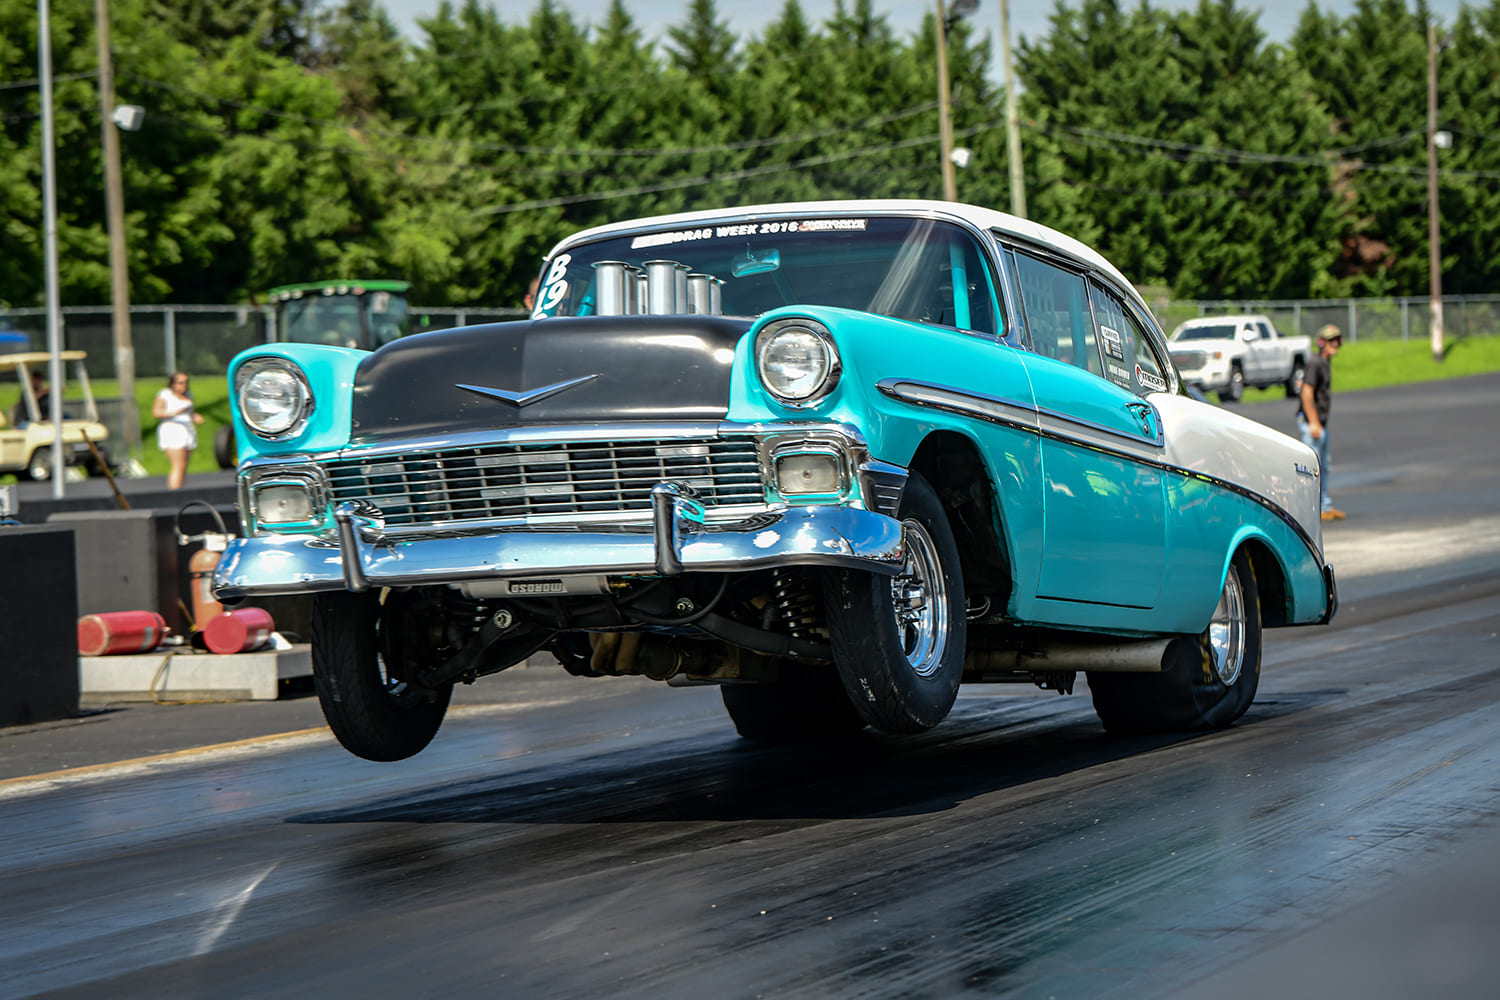
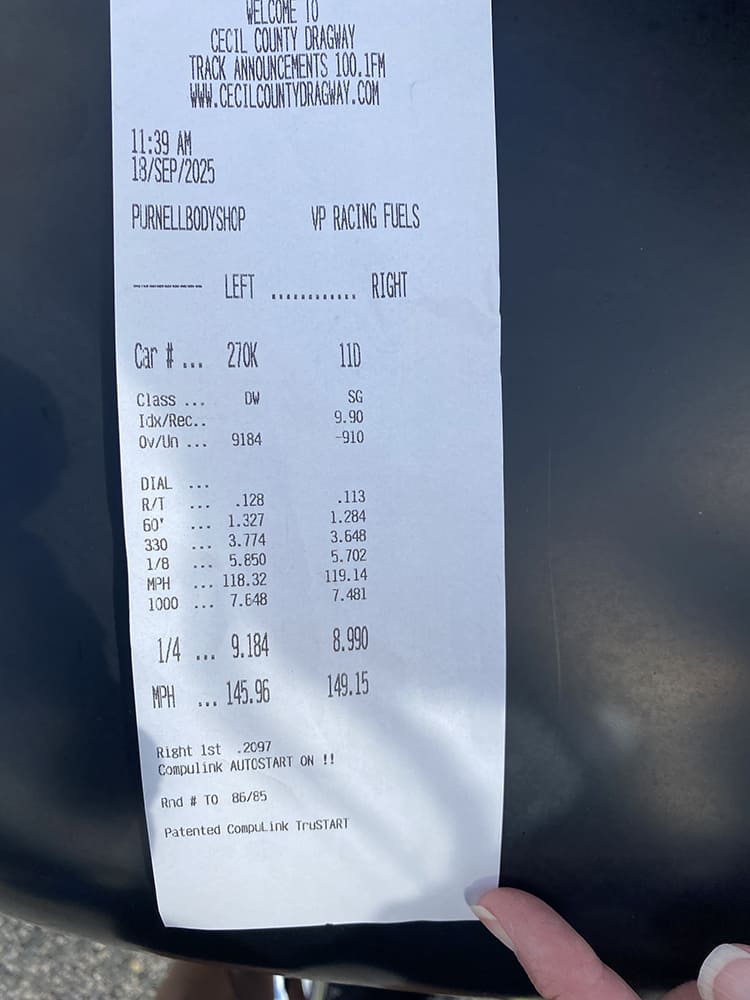
Next, we took a look at one of the great cars at Drag Week in 2025, Andy Starr’s green and white 1956 Chevy. The car is powered by a 582ci, 13:1 compression big-block Chevy running a Dart block with Brodix -3 oval-port heads and a big, Bullet mechanical roller camshaft. Combined with Hilborn electronic fuel injection and backed by a G-Force five-speed manual trans. This shoebox is very quick. The car’s previous best had been 9.32 at 148 mph, but during Drag Week 2025, Starr recorded his best e.t. ever, 8.990 at 149.15 mph. What makes this effort even more impressive is that this car weighs a hefty 3,950 pounds ready to race so it’s no lightweight. We immediately plugged his 149.15-mph run into our calculator and it revealed an idealized 8.850 e.t.– a mere 0.14-second quicker. This is a testament to how well Starr has optimized his machine.
Just for fun, his timeslip also indicated a 5.702 at 119.14 mph at the 660-foot mark so we plugged his numbers into the formula for eighth-mile effort and came up with a 5.539 estimate for his speed at the 660-foot mark. Starr has to manage clutch slippage on the starting line and the gear changes, and this may be why his 660-foot time is a bit slower.
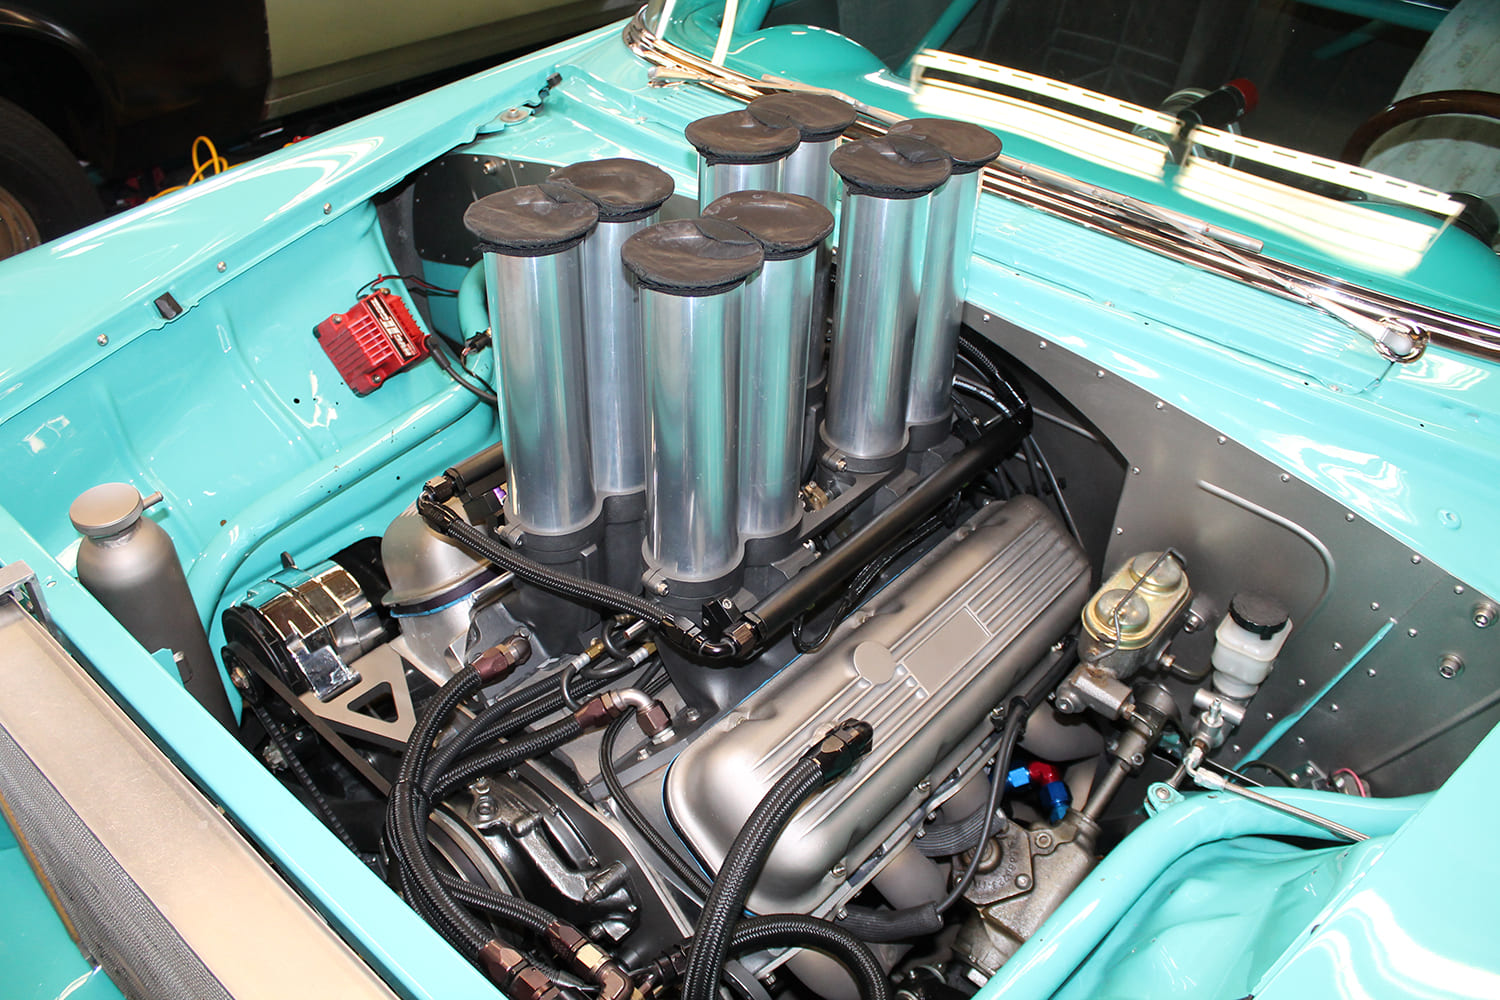
One item Starr has mentioned about this car is its strong midrange torque. This 582ci rat makes 800 lb-ft of torque at the rear tires and some of that can be attributed to the Hilborn EFI stacks that tend to improve midrange power. The fuel and spark are managed by a Holley HP ECU, and evidenced by his skill at tuning, which is also his business now, running Starr Performance Tuning and Consulting.
Some might question why this simple equation should warrant all this attention. The answer depends greatly upon how much you are interested in optimizing a car’s quarter-mile performance. Let’s say your four-speed, small-block Camaro runs 14.50s at 100 mph. The math on this is easy since the idealized e.t. would be 13.20. This reveals that you already have the horsepower to run somewhere close to 13.50s, so the question of running quicker isn’t about power but rather the best approach to apply the power you already have to improve your car’s acceleration.
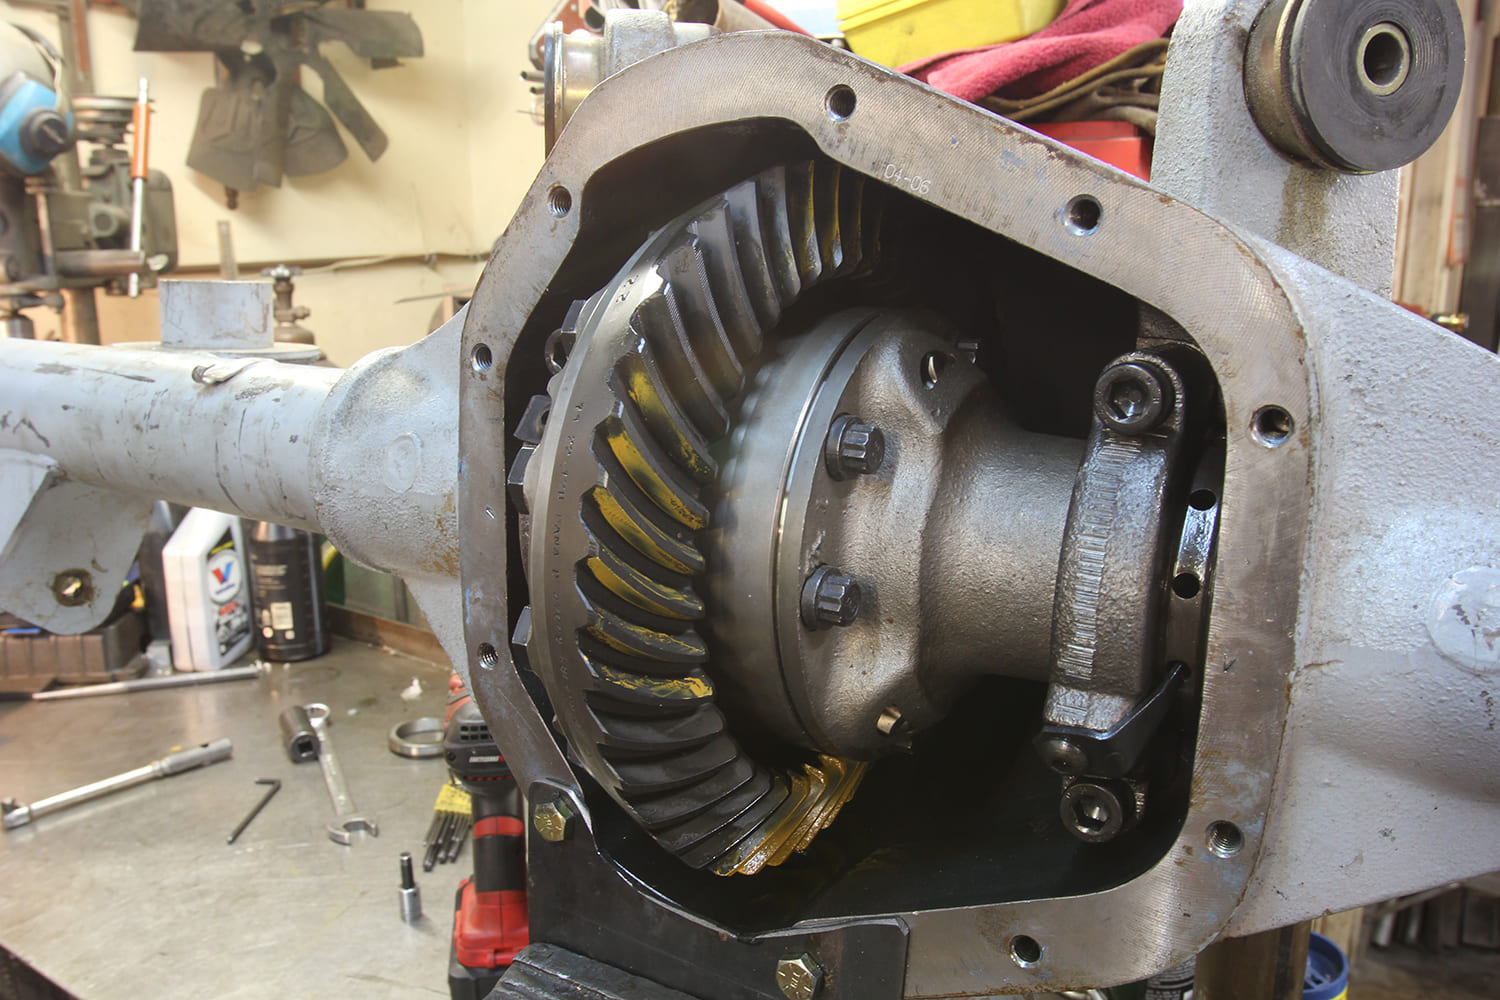
For quarter-mile running, nearly all street cars are under-geared. In the case of this theoretical Camaro, the issue should first focus on traction. Assuming 60-foot times in the 2-second range for a 14.40 e.t., the first thing to do would be to improve traction with sticky tires and a set of traction bars. Then, with better traction you’ll need deeper gears, like a set of 3.73:1 or 4.11:1 gears, which will drastically improve acceleration. This sets you on the path toward a quicker e.t. and the process can become extremely addictive in maximizing the car’s potential. Of course, as this work continues, it begins to make the car more of a race car and less of a street car, unless you decide to update the car with an overdrive transmission.
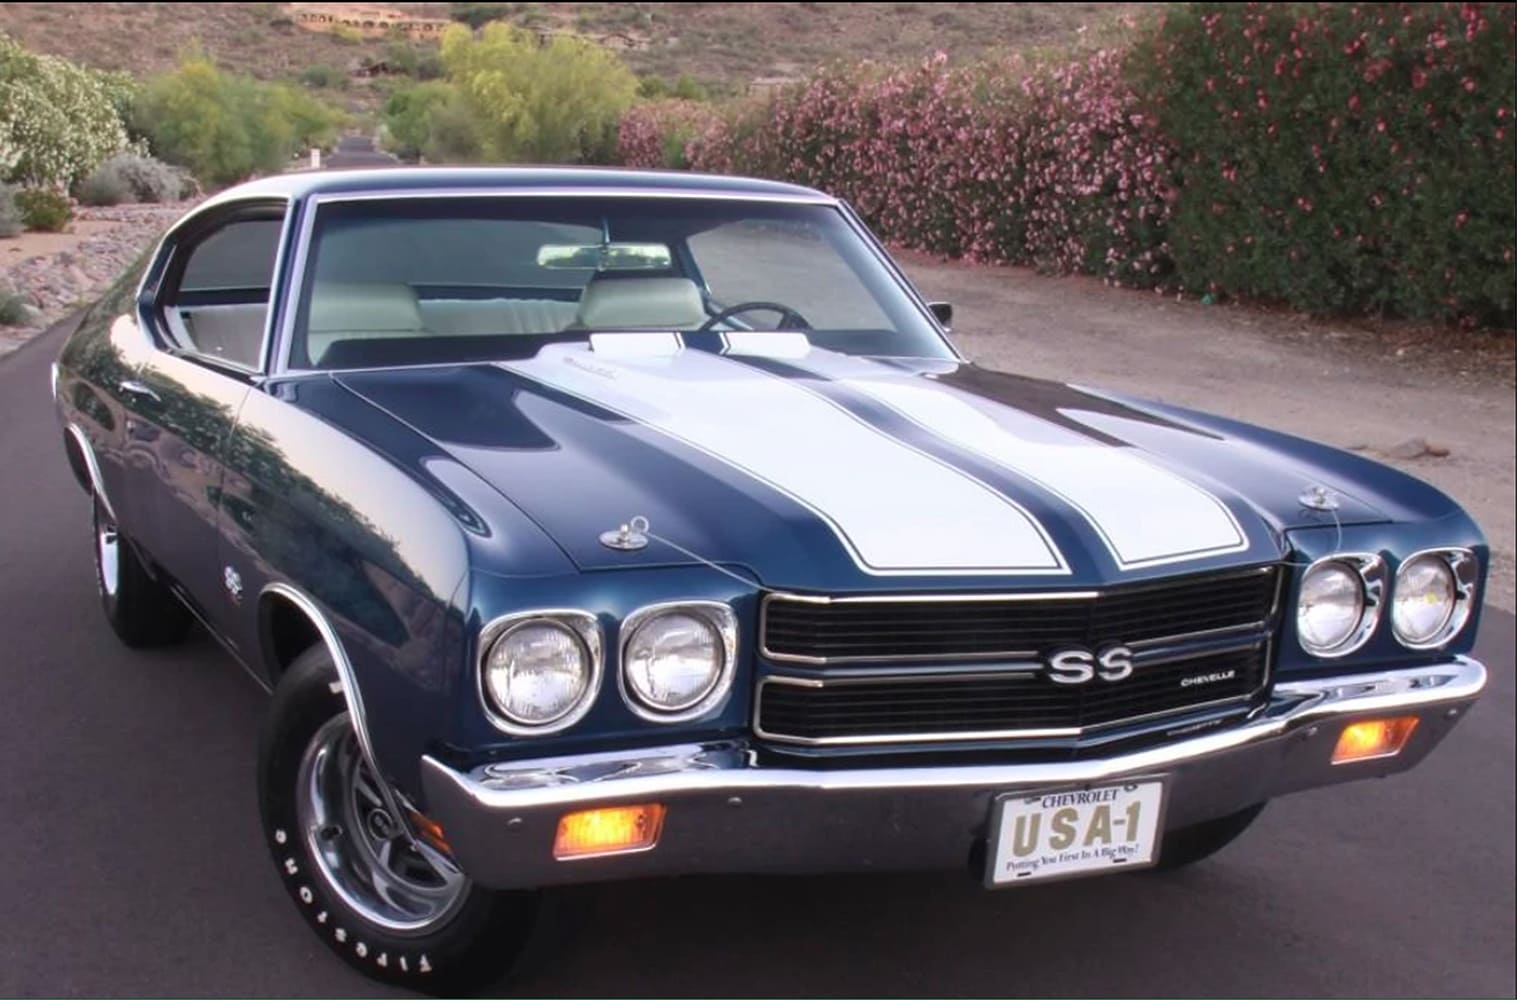
This formula isn’t limited to just racers. If you’re a spectator, pull out your smartphone and amaze your friends by informing them of which cars running down the track are coming close to their potential and which ones are e.t. slackers. If an acquaintance boasts that his 800hp big-block Chevelle runs 11.20s at 132 mph, with the help of this formula it won’t take you long to realize that his car isn’t all that impressive. With that trap speed, his bad-boy Chevelle should be running closer to 10-flat (1320 / 132 = 10.00). But tread carefully when broaching subjects like this. Some guys (especially the boastful ones) are not likely to graciously accept your observations!
Before we wrap this up, note that this is a simple device you can use to estimate quarter- or eighth-mile performance. It is not the last word for all cars. That means it works well for normally aspirated cars, but not necessarily for blown, nitrous, or turbocharged cars, since they have an abundance of horsepower that must be managed. Often, these cars pull back power to manage tire slippage, and this affects the overall elapsed time.
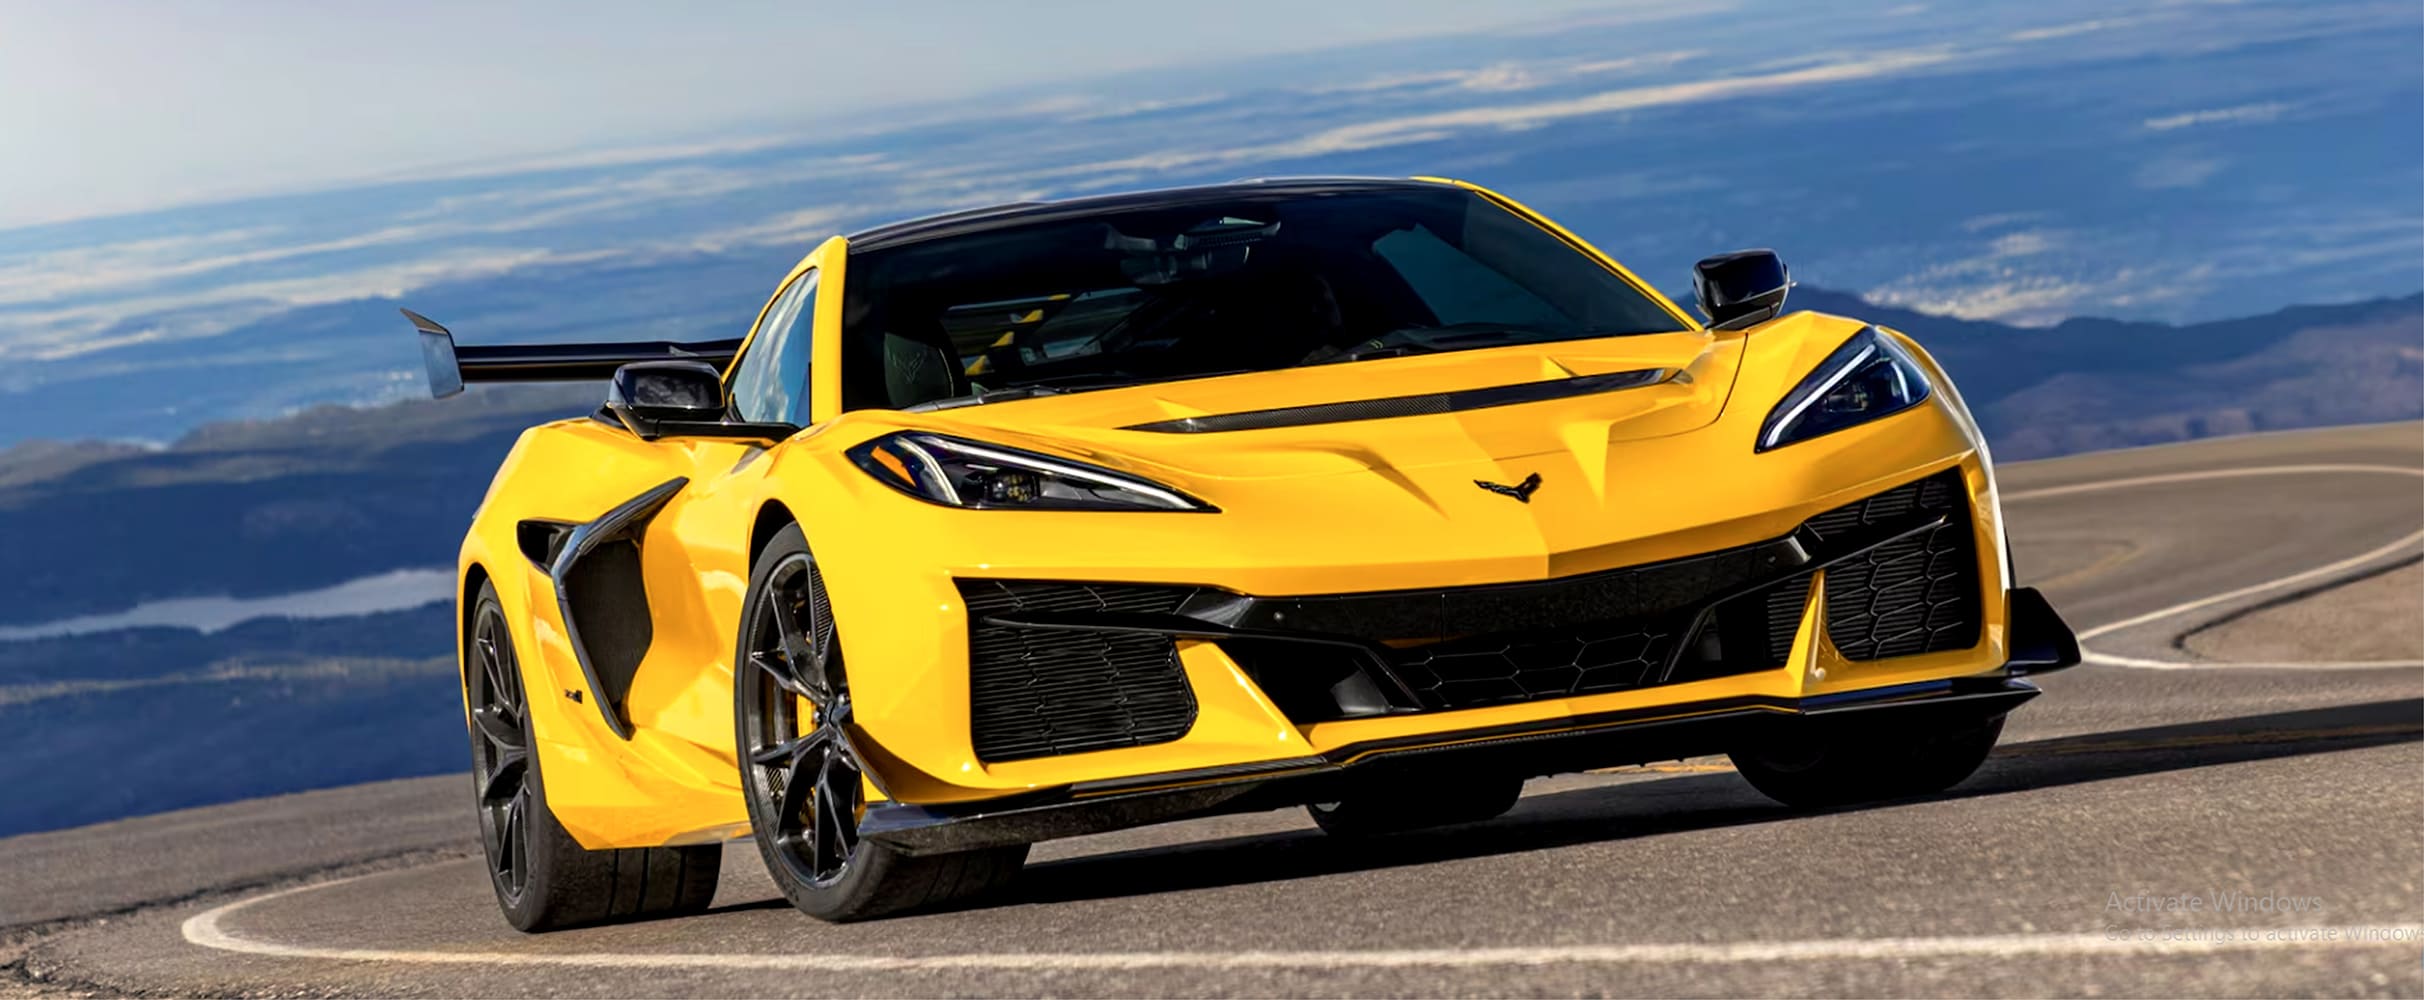
Just for fun, we plugged in the 1,052hp twin-turbocharged Corvette ZR1, which, according to factory literature, runs 9.60 at 150 mph. The equation tells us that mph could generate a much-quicker 8.80-second elapsed time. Ultimately, a 9.60 pass is downright amazing for a production car with street tires right off the showroom floor.
Hopefully we’ve revealed some things or perhaps clouded the issue a bit as to why your car does not quite equal the formula’s expectations. If so, that’s a great excuse to get out to the dragstrip and work on making your car quicker. It’s a lot of fun!
Check out this story in our digital edition here.
Optimized Quarter-Mile E.T. From MPH
|
MPH |
Optimized E.T. |
|
100 |
13.20 |
|
102 |
12.941 |
|
104 |
12.692 |
|
106 |
12.453 |
|
108 |
12.222 |
|
110 |
12.000 |
|
112 |
11.786 |
|
114 |
11.579 |
|
116 |
11.379 |
|
118 |
11.186 |
|
120 |
11.000 |
|
122 |
10.819 |
|
124 |
10.645 |
|
126 |
10.476 |
|
128 |
10.312 |
|
130 |
10.154 |
Optimized Eighth-Mile E.T. From MPH
|
MPH |
Optimized E.T. |
|
70 |
9.42 |
|
80 |
8.25 |
|
85 |
7.76 |
|
90 |
7.33 |
|
92 |
7.17 |
|
94 |
7.02 |
|
96 |
6.87 |
|
98 |
6.73 |
|
100 |
6.60 |
|
102 |
6.47 |
|
104 |
6.34 |
|
106 |
6.22 |
|
108 |
6.11 |
|
110 |
6.00 |
|
112 |
5.89 |
|
114 |
5.78 |
Calculating E.T. and MPH From Horsepower and Weight
Just to add additional spice by sprinkling some slightly more complex math into this story, there are several formulas that estimate elapsed time from vehicle weight and flywheel horsepower. We obtained this formula from Patrick Hale who used it in his Quarter, Pro dragstrip simulation computer program.
E.T. = 5.825 x (Weight / HP) 1/3
This may look intimidating—what the devil is that 1/3 number? If you recall from high school algebra, the square root symbol looks like this: √. The cube root looks like this: . That 1/3 power is the same as cube root. The good news is that all smartphones feature a scientific calculator. Find that on your phone and the calculator will do all the heavy lifting!
Here’s the math on our 550hp Chevelle that weighs 3,600 pounds:
E.T. = 5.825 x (3600 / 550) 1/3
E.T. = 5.825 x (6.54) 1/3
E.T. = 5.825 x 1.87
E.T. = 10.892
MPH = 234 x (HP/Weight) 1/3
MPH = 234 x (550 / 3600) 1/3
MPH = 234 x (0.1528) 1/3
MPH = 234 x 0.5346
MPH = 125.09
These numbers show that our Chevelle could potentially run 10.89 at 125.09 mph, but then if we plug in our original calculated e.t. based on the trap speed shown with this formula, we get 10.552 as a calculated optimized elapsed time. There are a ton of assumptions involved with these calculations, but remember, these are estimates. The main point is that your actual trap speed is an accurate indication of torque and horsepower. This is the kind of stuff we wish our high school math teacher would have put on the blackboard. We may have paid more attention!